Understanding WTE (Whole-Time Equivalent)
WTE (Whole-Time Equivalent) is a standardised way of measuring staffing levels. It shows how many full-time workers are needed to cover your scheduled shifts each week and how that compares to the actual capacity of your current workforce.
WTE is calculated by dividing total working hours by the number of hours defined as a full-time working week at your facility. This value is set by the administrator in the WTE Configuration — for example, if full-time is set to 40 hours per week, then 1.0 WTE equals one full-time employee working 40 hours per week. All WTE calculations across the system use this value as the baseline.
The system tracks three key WTE values at all times:
- Available WTE — the combined weekly capacity of all your employees based on their contracted hours, divided by your full-time hours setting. This tells you how much workforce you actually have.
- Required WTE — the total hours needed to cover all scheduled shifts for the week, based on the shift requirements entered per department and shift type, divided by your full-time hours setting. This tells you how much workforce your roster demands.
- Balance — Available WTE minus Required WTE. A positive number means you have a surplus of capacity. A negative number (shown as Deficit) means your current staff cannot fully cover the scheduled shifts and additional cover may be needed.
WTE data is calculated per department based on the shift requirements you have set up, and the dashboard shows trends for the current week and the previous 10 weeks — giving you a clear picture of staffing patterns over time.
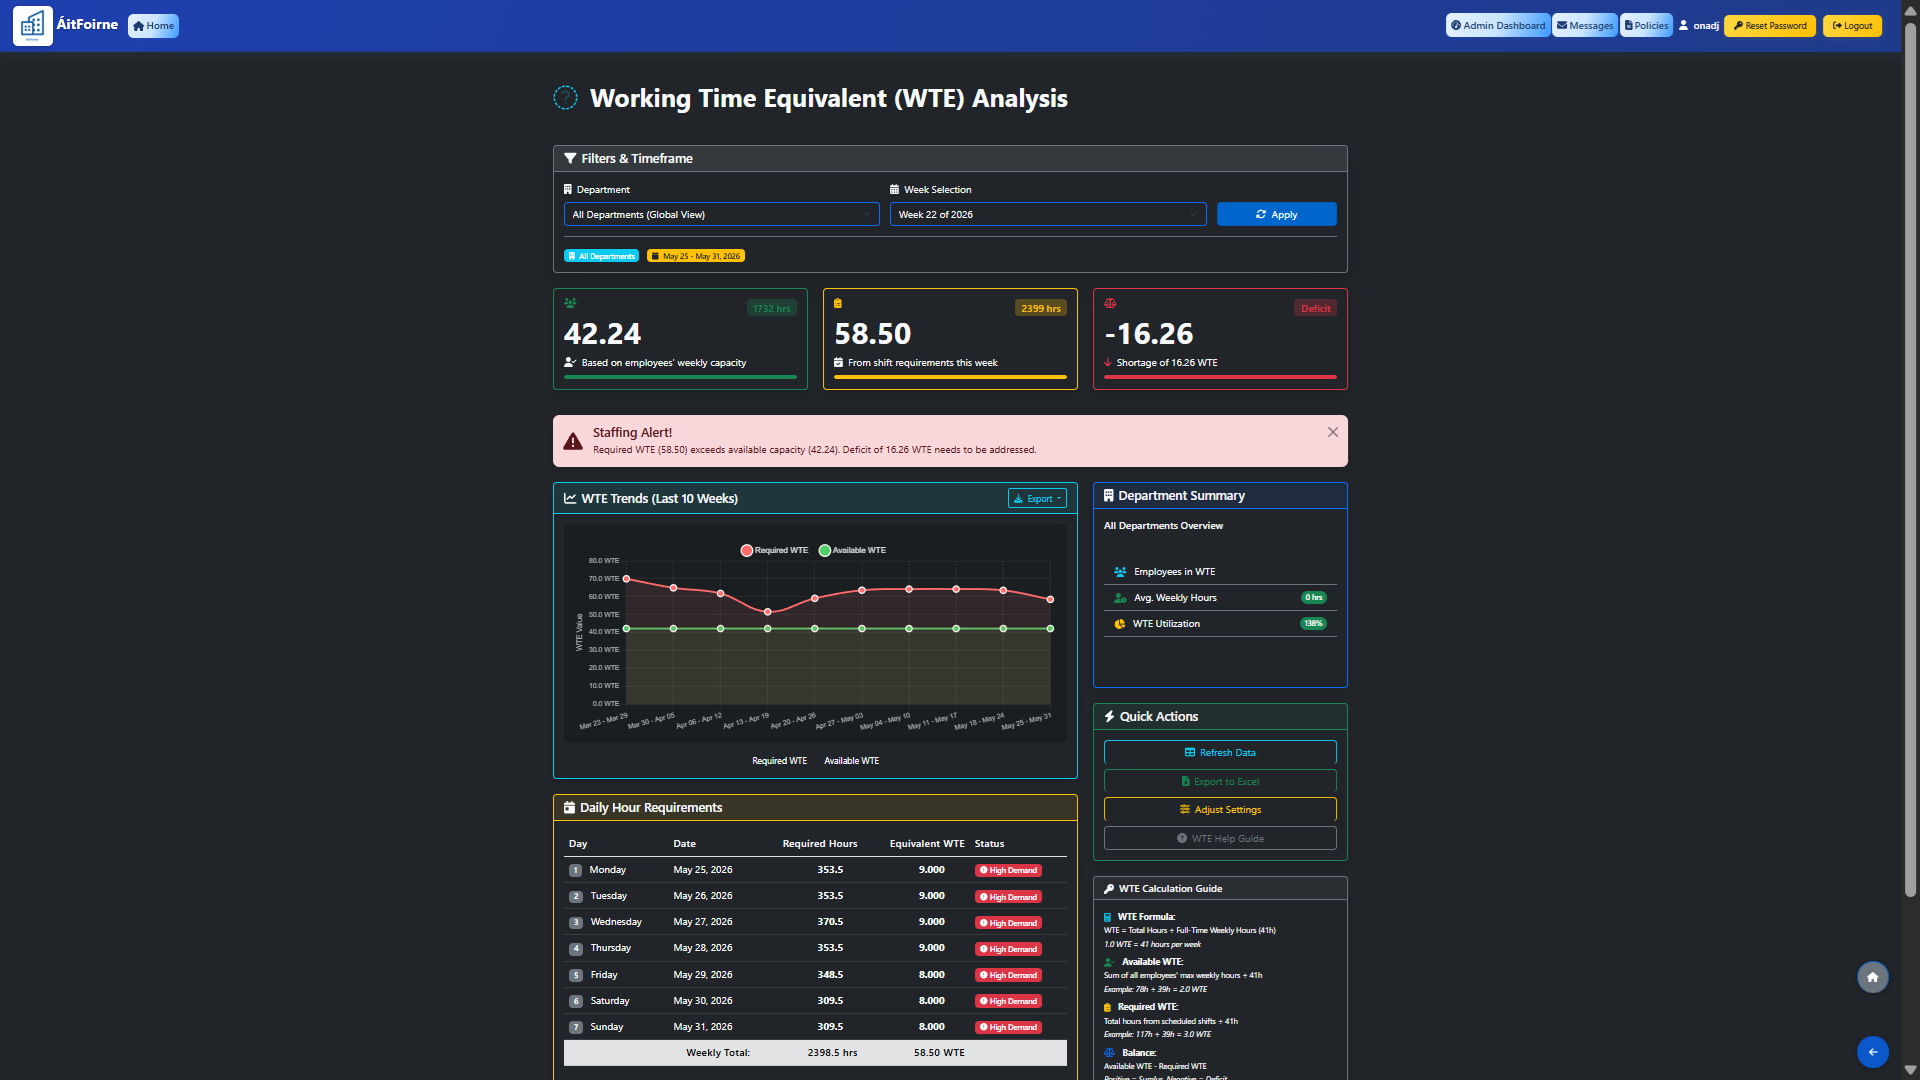
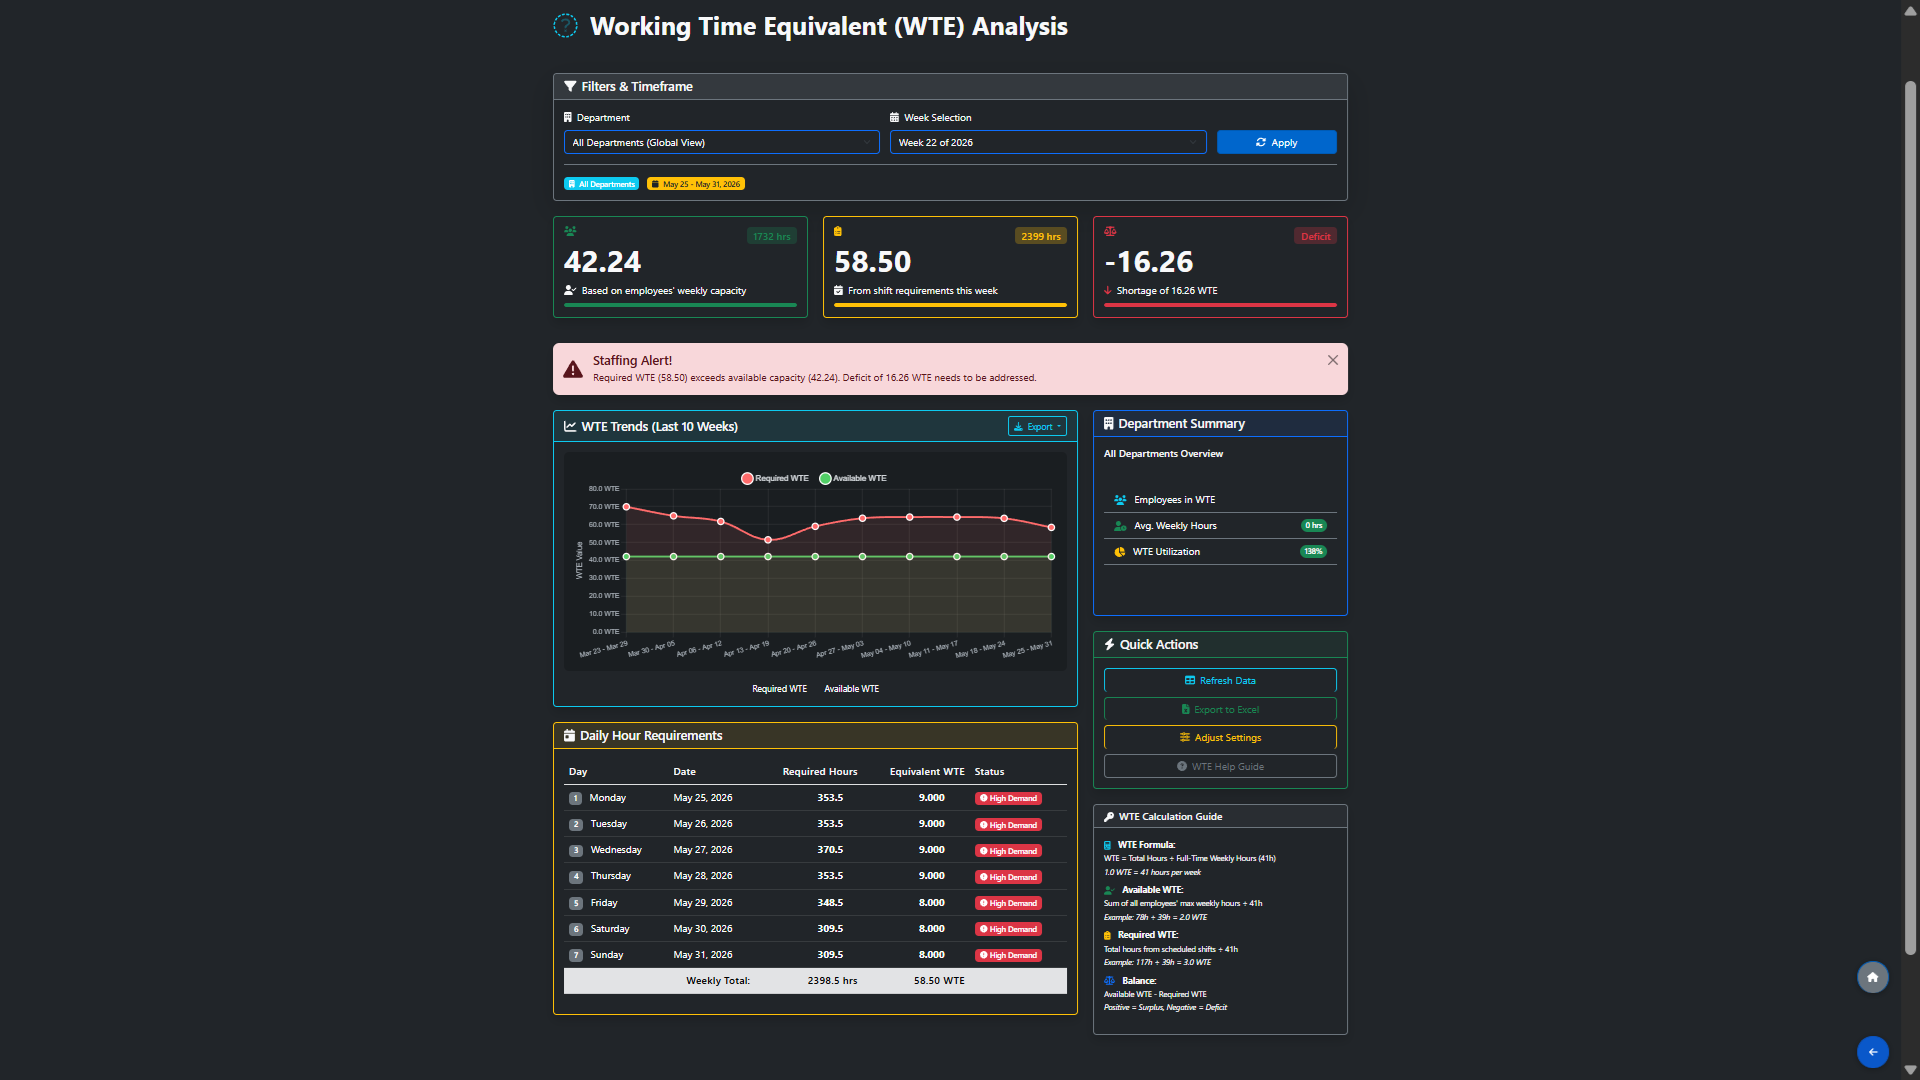
Open WTE from the main dashboard. Use the Department and Week Selection filters to view data for a specific department or across all departments, then click Apply.
The three summary cards at the top show your Available WTE, Required WTE and Balance for the selected period. If the Required WTE exceeds your Available WTE, a Staffing Alert will appear clearly indicating the deficit and the number of WTE that needs to be addressed.
Below the summary you will see a weekly trend chart comparing Required WTE (red line) against Available WTE (green line) over recent weeks, and a Daily Hour Requirements table showing the required hours and equivalent WTE for each day of the week — with a status indicator such as High Demand where staffing pressure is greatest.